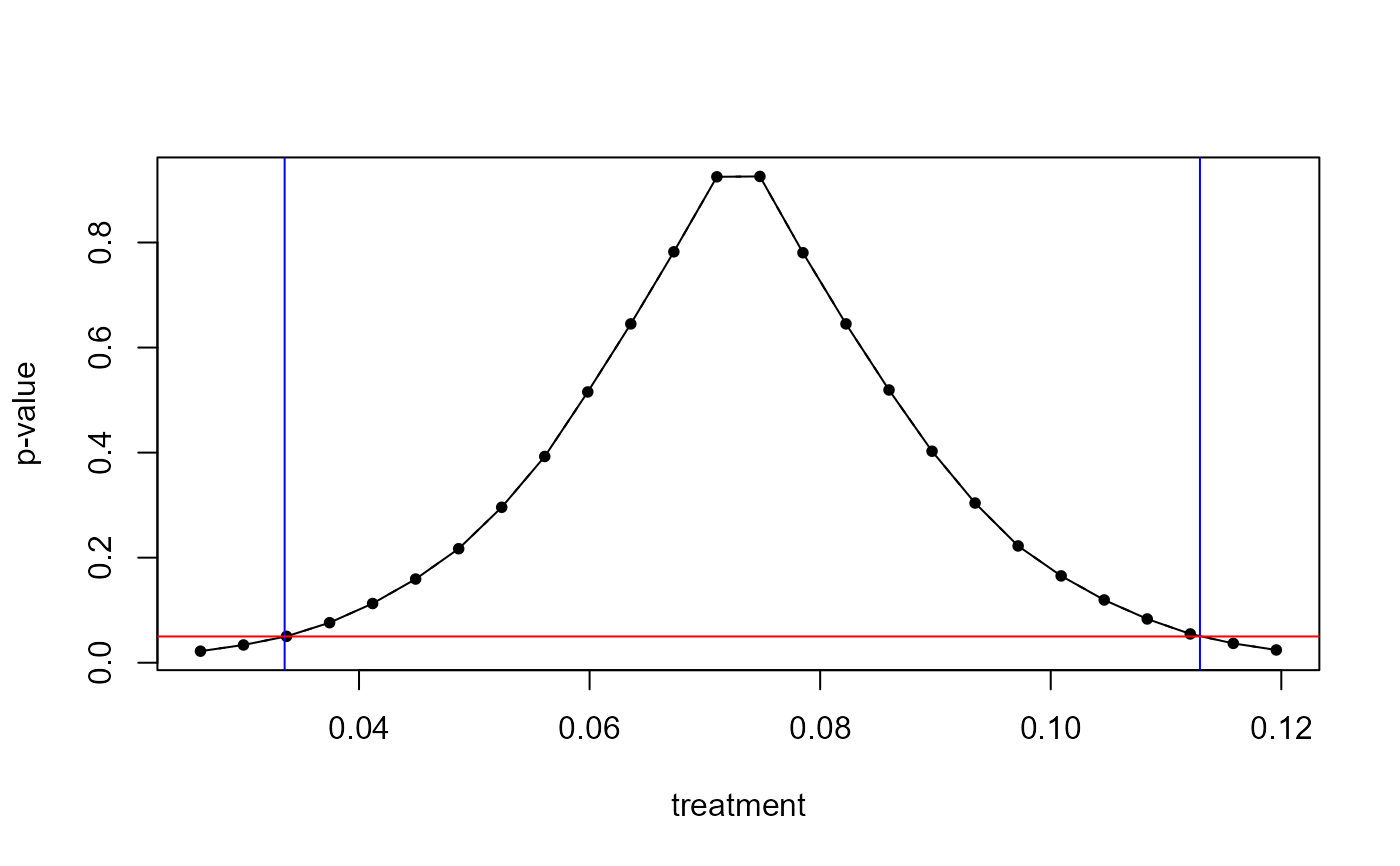
Plots bootstrapped p-values as a function of the hypothesized effect size r for a hypothesis test of the form R beta = r.The points where the p-values are 0.05 are the boundaries of the bootstrapped confidence interval.
Source:R/methods.R
plot.boottest.RdPlots bootstrapped p-values as a function of the hypothesized effect size r for a hypothesis test of the form R beta = r.The points where the p-values are 0.05 are the boundaries of the bootstrapped confidence interval.
Usage
# S3 method for boottest
plot(x, ...)Examples
requireNamespace("fwildclusterboot")
data(voters)
lm_fit <- lm(
proposition_vote ~ treatment + ideology1 + log_income + Q1_immigration,
  data = voters
)
boot <- boottest(lm_fit,
  B = 9999,
  param = "treatment",
  clustid = "group_id1"
)
plot(boot)
